Learnings from the first click
When you want to create an outstanding user experience, you have to understand how the users interact with your design. It is in particular interesting to know, where the users start their interaction.
The first clicks tell you which elements catch the most attention.
Heat maps are an extremely powerful tool. They are easy to interpret and visualize where the users have clicked most often. Unfortunately heat maps aggregate all clicks. As a consequence, you can not find out which were the first actions of the users.
Quant-UX.com introduced, therefore, the possibility to apply filters on their click heat maps. You can decide if you want to see all clicks, just the first click or the first three clicks.
 Heatmaps are an essential UX tool.
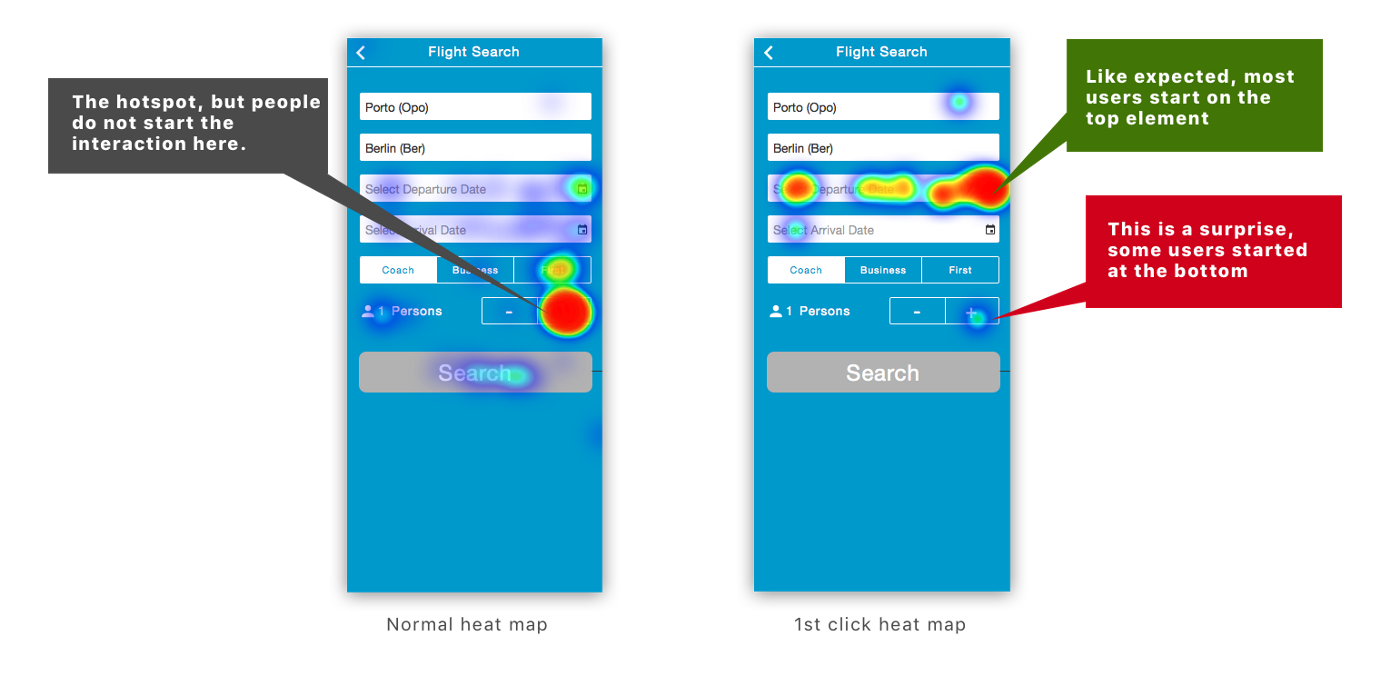
Have a look at the example above. The users had to search a flight for six persons, and we expected them to fill out the form from top to down (Read more about the experiment).
On the right hand side, there is a normal click heat map. It shows where the users have clicked most of the time. In this case the “+” button of the stepper control. This was an expected outcome of our experiment, because the users had to click 5 times on the element. The heat map on the left shows only the first clicks. It confirms our main assumption.
The 1st click heat map confirms our assumption
Most of the first clicks were on the top elements. In this case the departure date picker (The first two field were already filled out). However, a few users also interacted at first with the stepper (Try out the heat map here). This behavior is a kind of surprising, but not a big issue in this prototype. Lets have a look at a second example.
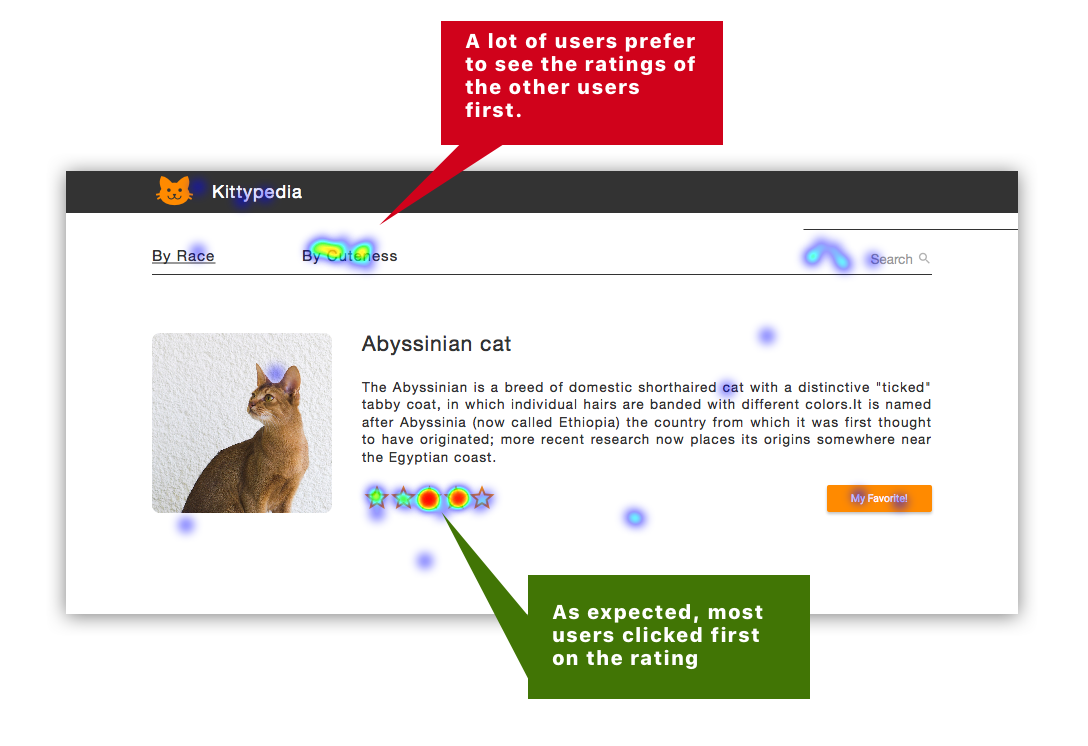 The first click heatmap
The users were asked to rate the cuteness of several cats. The heat map indicates that the majority of the users understood the task and clicked first on the rating control. But a large fraction also clicked on the “By Cuteness” link to reorder the list and see other users ratings. The pattern gives a strong hint, that the testers were actually very interested in knowing the other ratings. As a consequence, one could improve the user experience and select this option as default.
Summary
The first clicks help you to better understand the user behavior. Usually the users click first on the elements that catch their attention, given their current context. Also, the help you to understand the users preferences and design the user experience accordingly. Heat maps, which show only the first clicks, are a simple, yet powerful, way to visualize and understand the first interactions.