Quantitative UX Analytics
The build-in analytics help you to understand if your designs work or not. Test with real users and get immediate feedback.
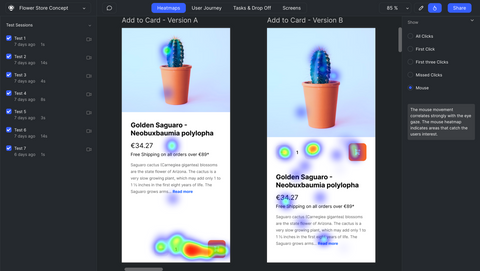
Heatmaps
Use the analytic canvas to get insights into the user's interaction. Heatmaps will tell you where the users have clicked, where the missed the action and how the mouse has moved.
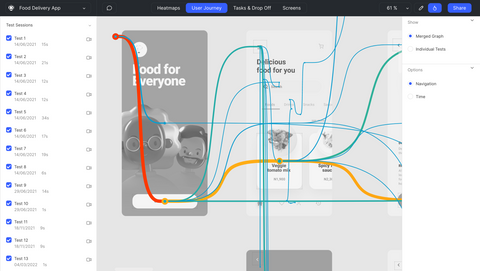
User Journey
The user journey graph is one of the best tools to understand the user behavior. They graph uncovers usability problems and make it easy to find lost users.
Drop Offs
The drop off graph shows where your users struggle while performing a task and how much time they spend on each step.
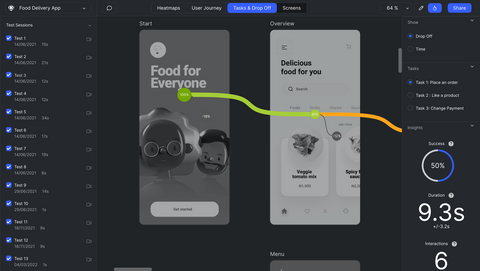
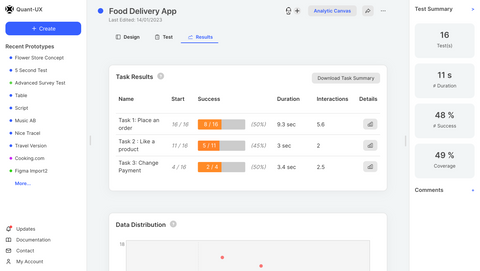
Dashboard
The task dashboard shows the key performance indicators (KPI) at a single glance. Analyze the task performance to understand if your design works or not.
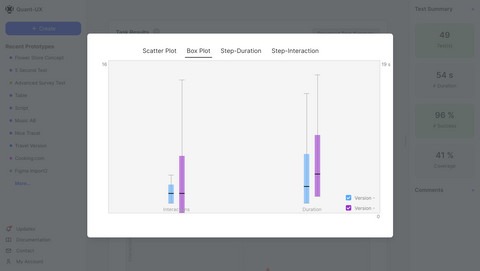
A / B Testing
You can visually compare the task performance for A/B tests. Understand the differences in task duration, success rate and the number of interactions.